Doctor Reports
Beverage & Headache Tracking Data
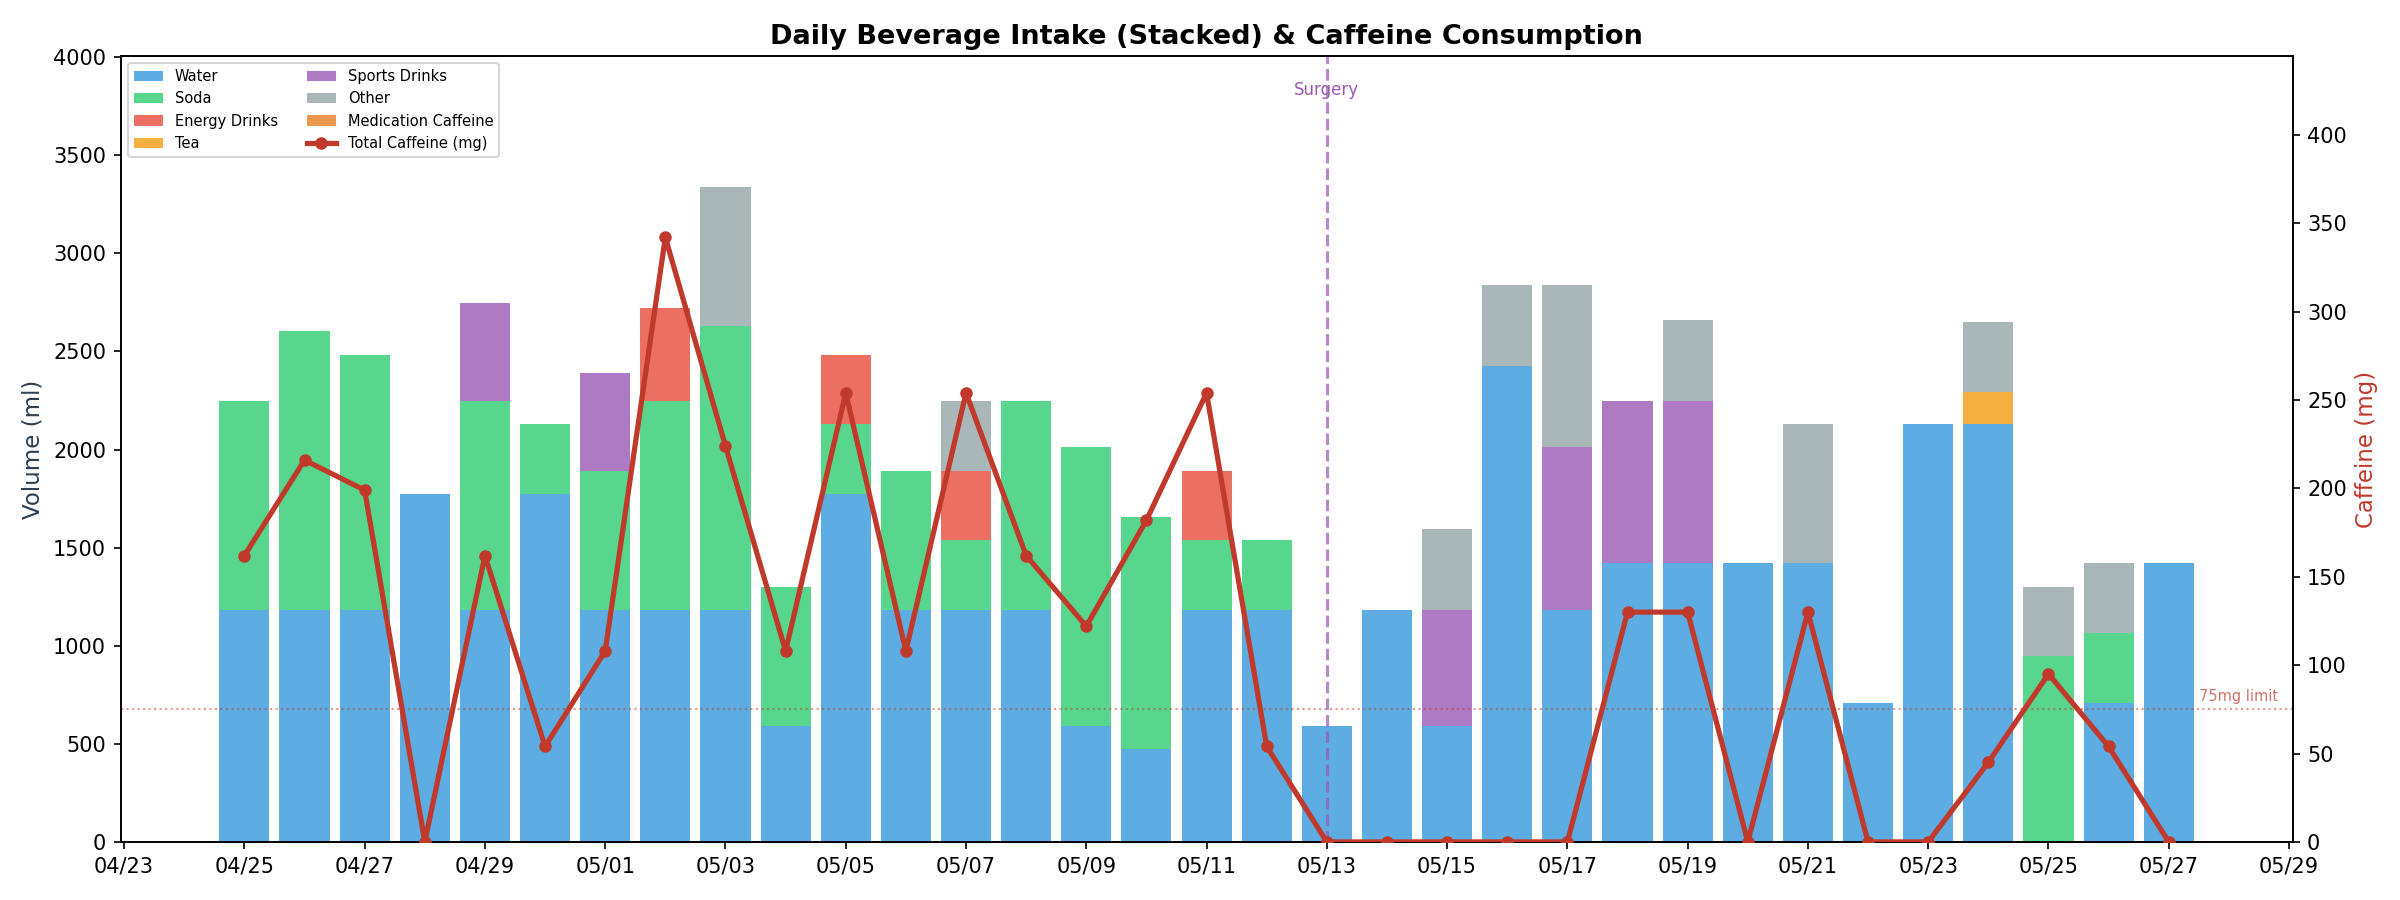
Daily Beverage Intake & Caffeine
Stacked beverage volume (ml) with caffeine overlay (mg)
Water
Soda
Energy
Tea
Sports
Caffeine line
Key Observations
- Peak hydration day: May 3 (~3,000+ ml total)
- Caffeine peaked May 3 at 340+ mg, well above the 75 mg limit line
- Caffeine dropped to zero around May 13 (surgery date)
- Water intake relatively consistent at ~1,200 ml/day
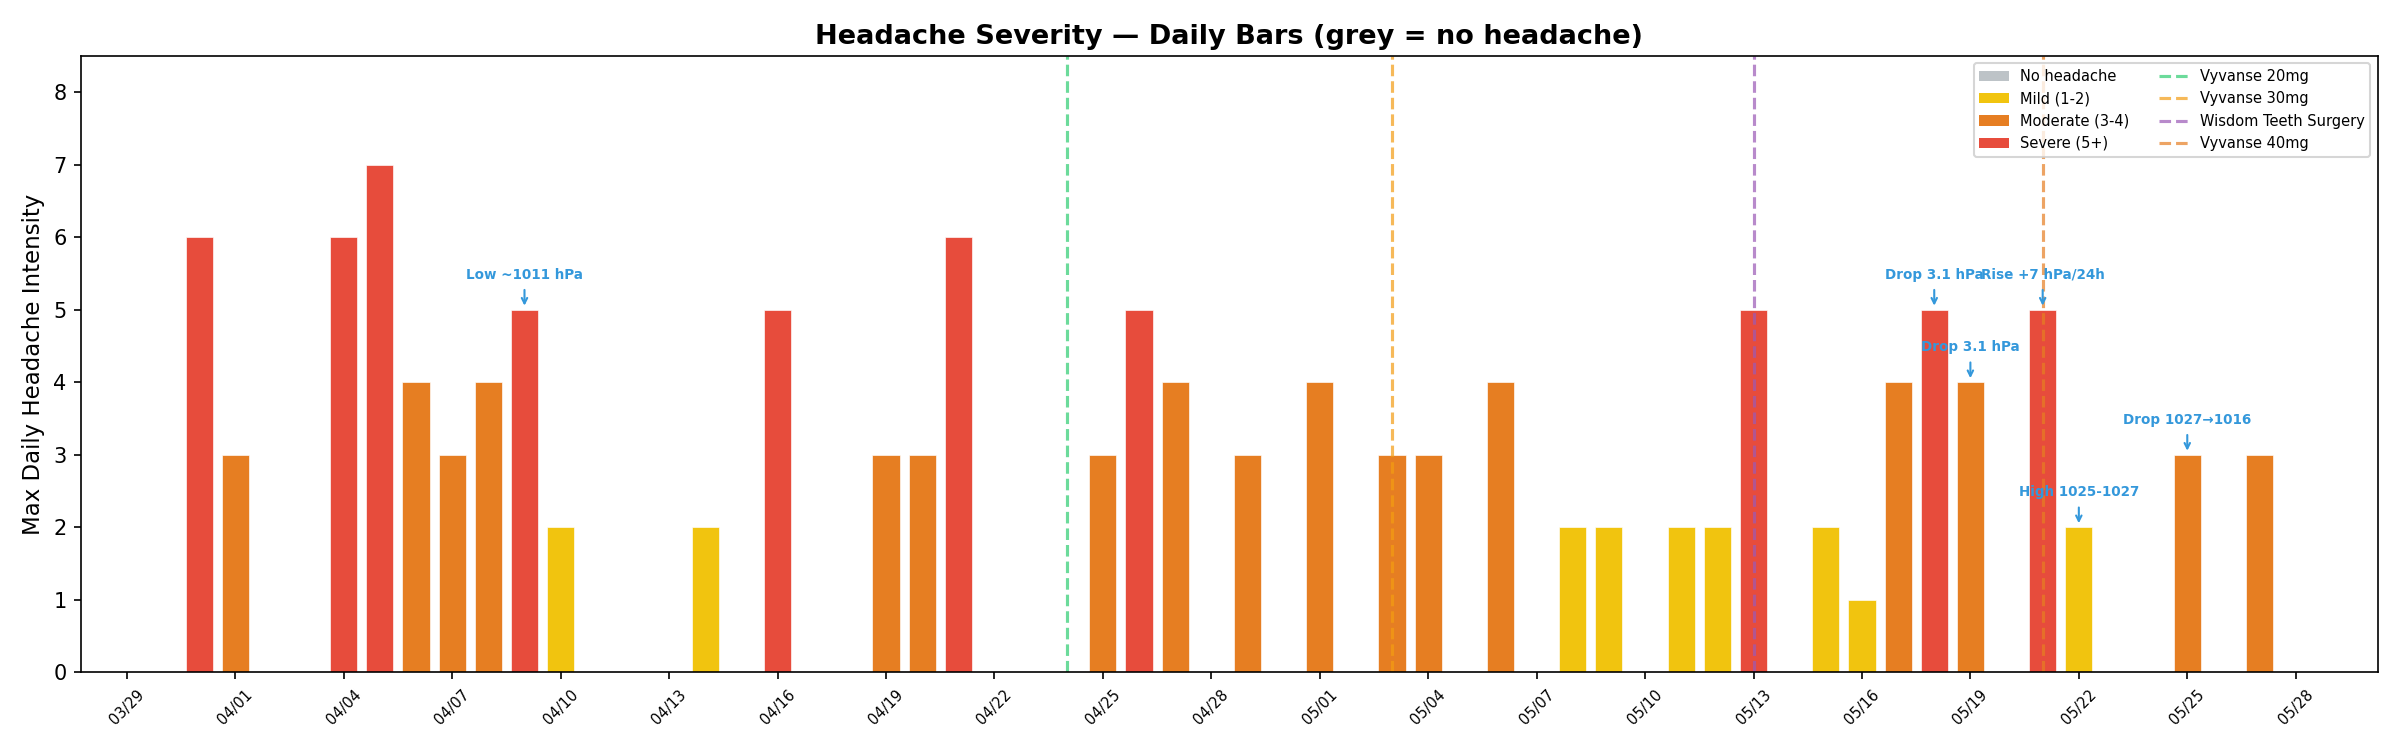
Headache Severity — Daily
Max daily intensity (0–8+) with medication changes and barometric pressure notes
Mild (1–2)
Moderate (3–4)
Severe (5+)
Vyvanse 20mg
Vyvanse 30→40mg
Surgery
Key Observations
- Most severe headaches (7/10) occurred in early April
- Vyvanse dose titrated: 20mg → 30mg → 40mg across the period
- Barometric pressure swings correlated with several headache spikes
- Post-surgery period shows reduced headache frequency and severity
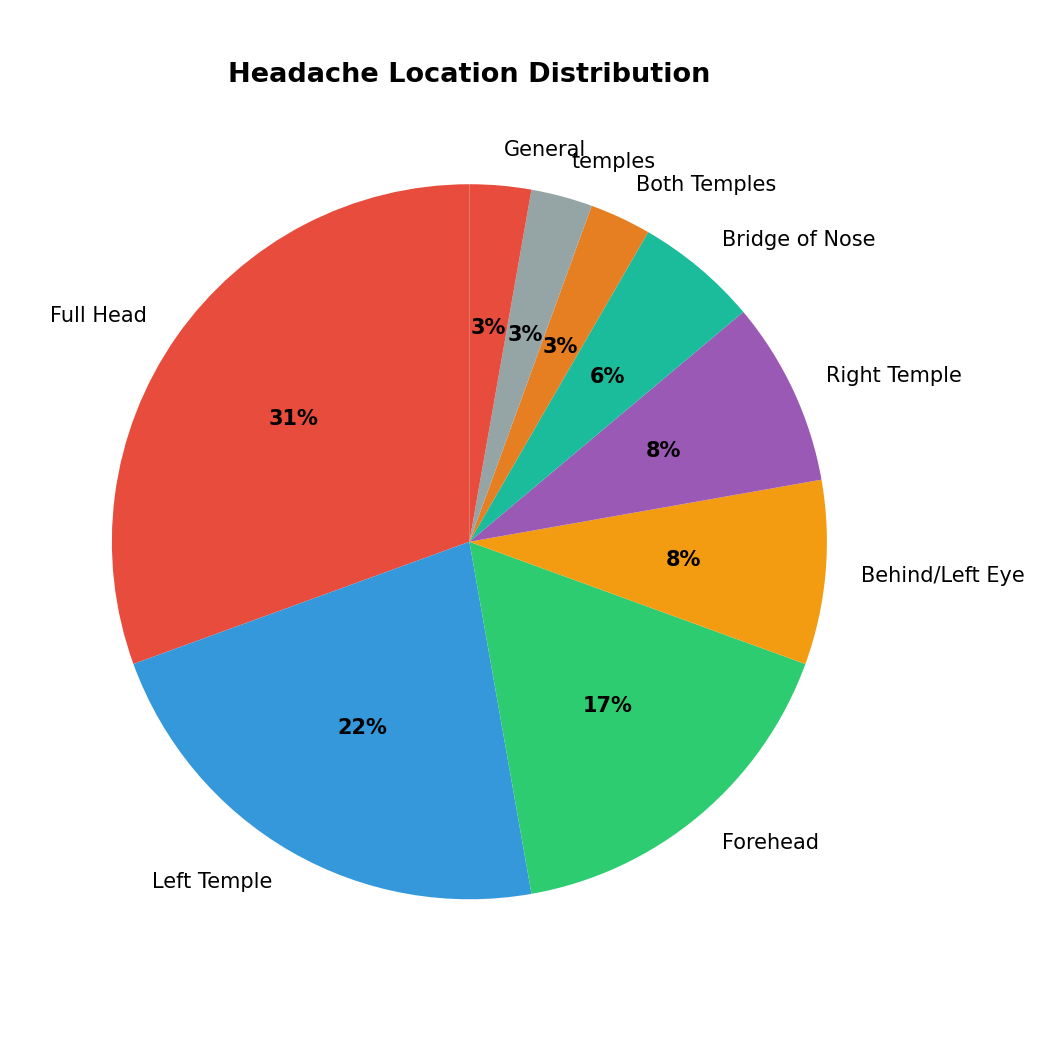
Headache Location Distribution
Percentage breakdown of where headaches are felt
Key Observations
- Full Head is the most common location at 31%
- Left Temple (22%) and Forehead (17%) are the next most frequent
- Unilateral left-side symptoms (Left Temple + Behind/Left Eye) total 30%
- Right-sided symptoms are less common (Right Temple at 8%)